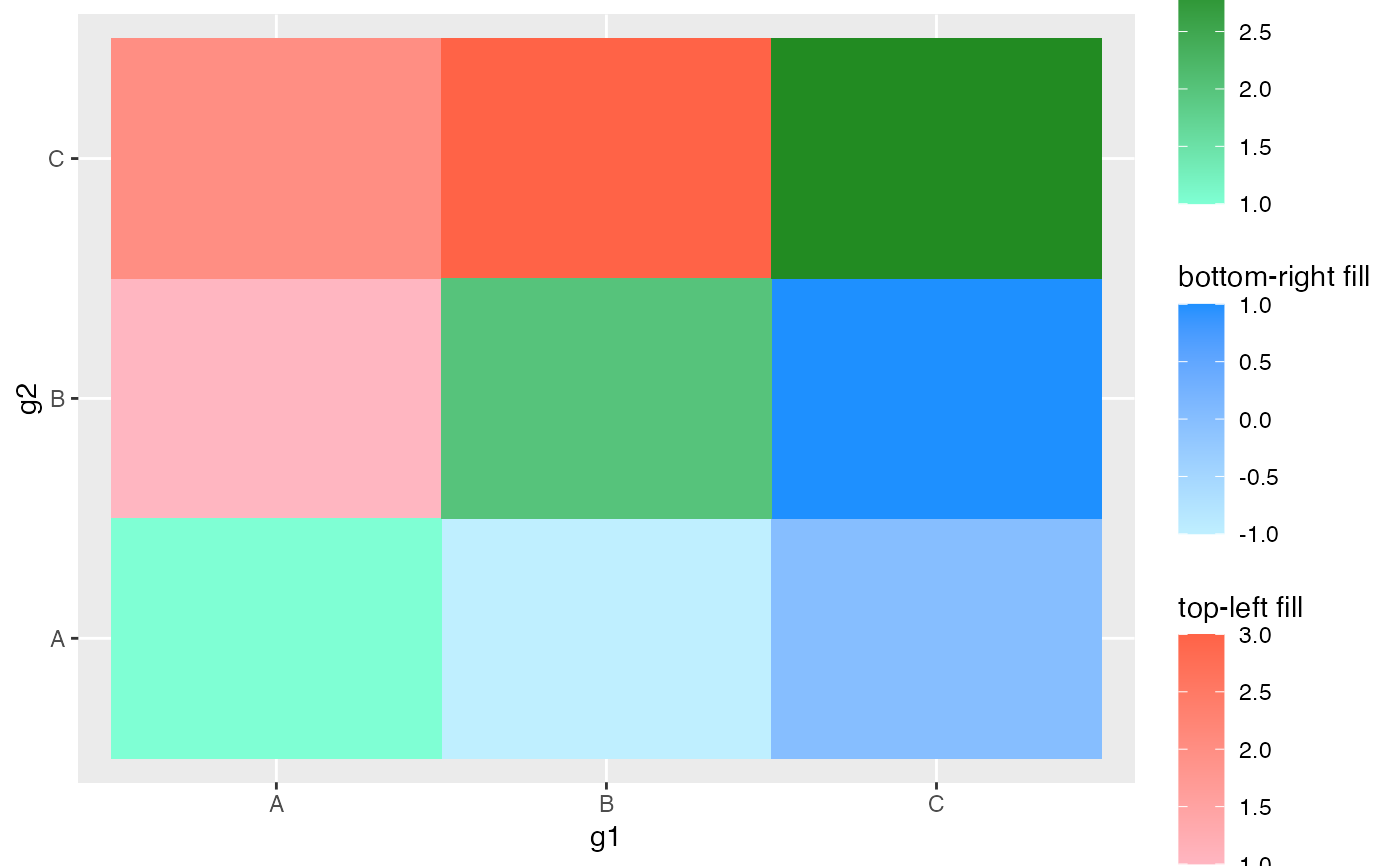
Generate an asymmetric matrix with different fill values for top-left
and bottom-right triangles and along the diagonal as a
ggplot() object
geom_asymmat(
  mapping = NULL,
  data = NULL,
  stat = "identity",
  position = "identity",
  ...,
  na.rm = FALSE,
  show.legend = NA,
  inherit.aes = TRUE
)
Arguments
| mapping | Set of aesthetic mappings created by |
|---|---|
| data | The data to be displayed in this layer. There are three options:
If |
| stat | The statistical transformation to use on the data for this layer, as a string. |
| position | Position adjustment, either as a string, or the result of a call to a position adjustment function. |
| ... | Other arguments passed on to |
| na.rm | If |
| show.legend | logical. Should this layer be included in the legends?
|
| inherit.aes | If |
Examples
library(tibble) library(ggplot2) suppressMessages(library(dplyr)) tib <- tibble( g1 = c("A", "A", "B"), g2 = c("B", "C", "C"), val_1 = c(1, 2, 3), val_2 = c(-1, 0, 1) ) tib#> # A tibble: 3 x 4 #> g1 g2 val_1 val_2 #> <chr> <chr> <dbl> <dbl> #> 1 A B 1 -1 #> 2 A C 2 0 #> 3 B C 3 1tib <- asymmetrise(tib, g1, g2) tib$val_3 <- NA tib$val_3[tib$g1 == tib$g2] <- c(1, 2, 3) ggplot(tib, aes(x = g1, y = g2)) + geom_asymmat(aes(fill_tl = val_1, fill_br = val_2, fill_diag = val_3)) + scale_fill_br_gradient(low = "lightblue1", high = "dodgerblue") + scale_fill_tl_gradient(low = "lightpink", high = "tomato") + scale_fill_diag_gradient(low = "aquamarine", high = "forestgreen") + labs(fill_tl = "top-left fill", fill_br = "bottom-right fill")
