This function is very simillar to the show_cols() in 'scales'. The
main difference is that this function returns a true ggplot2 object.
This allows for further customization.
show_palette(cols, num_rows = "square", label_size = 5,
  font_family = "Times", base_size = label_size, ...)
Arguments
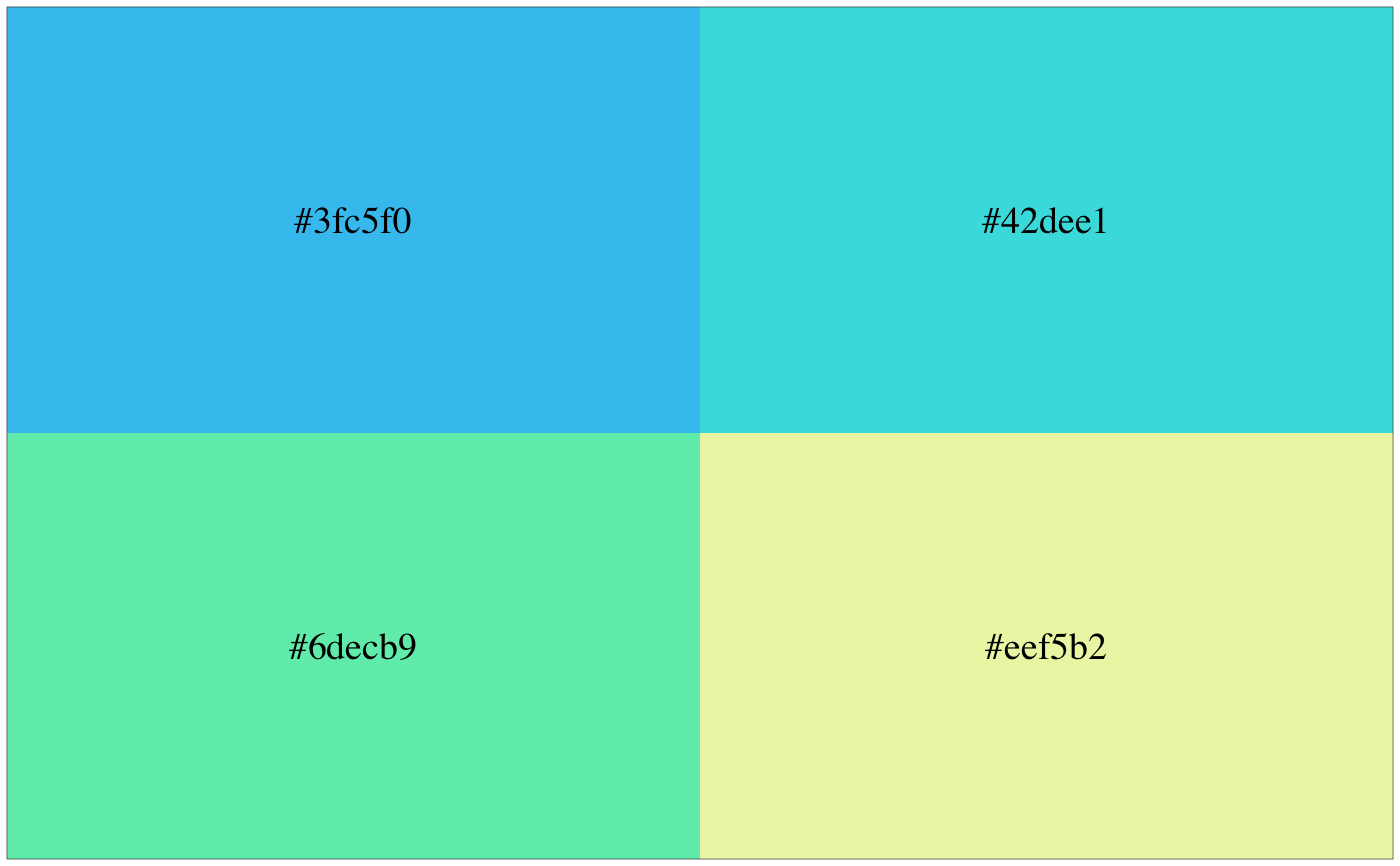
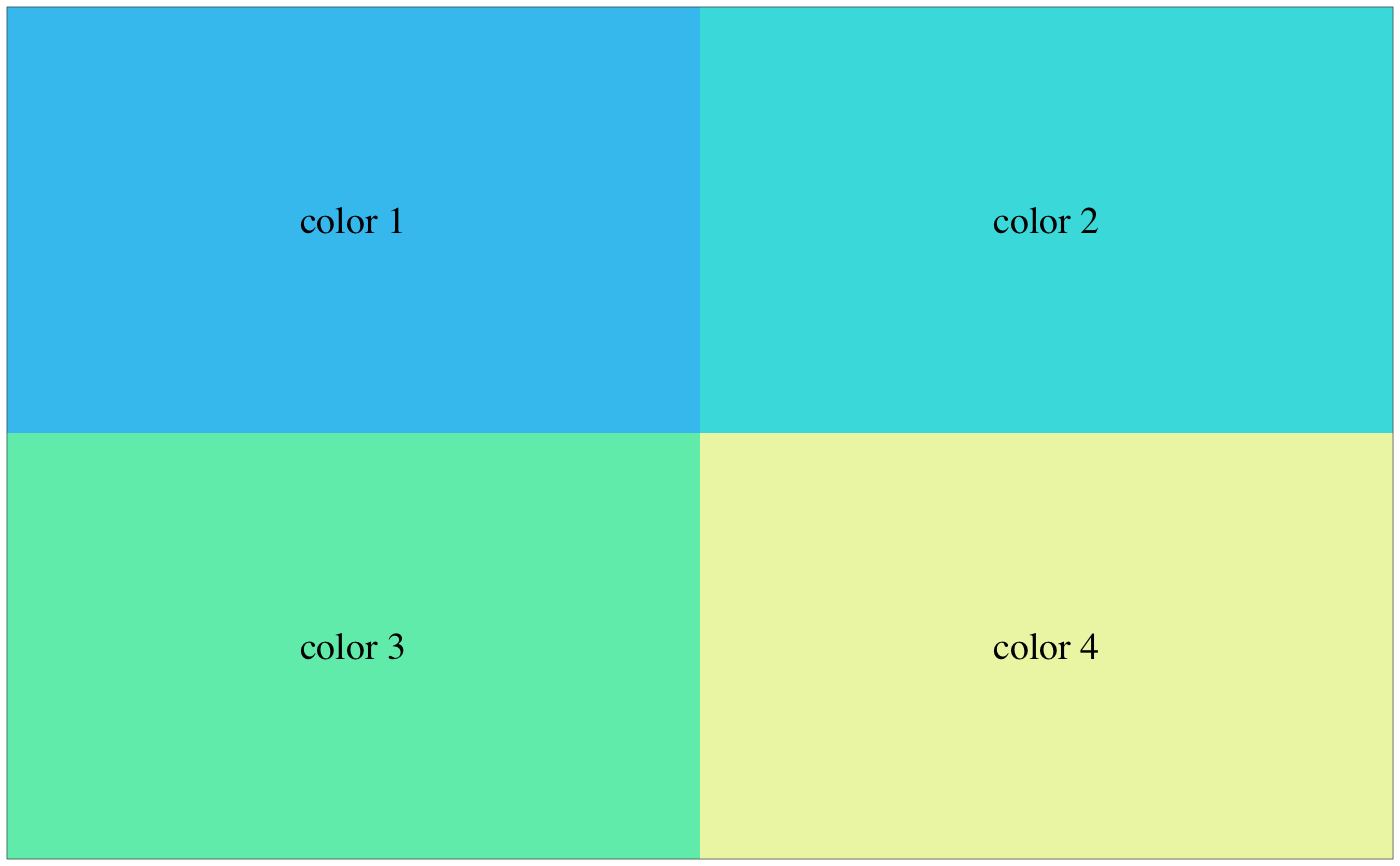
| cols | The colors to present in a matrix. If the values are named, these will be used for the cell label. If not, then the color value itself is used for the label. |
|---|---|
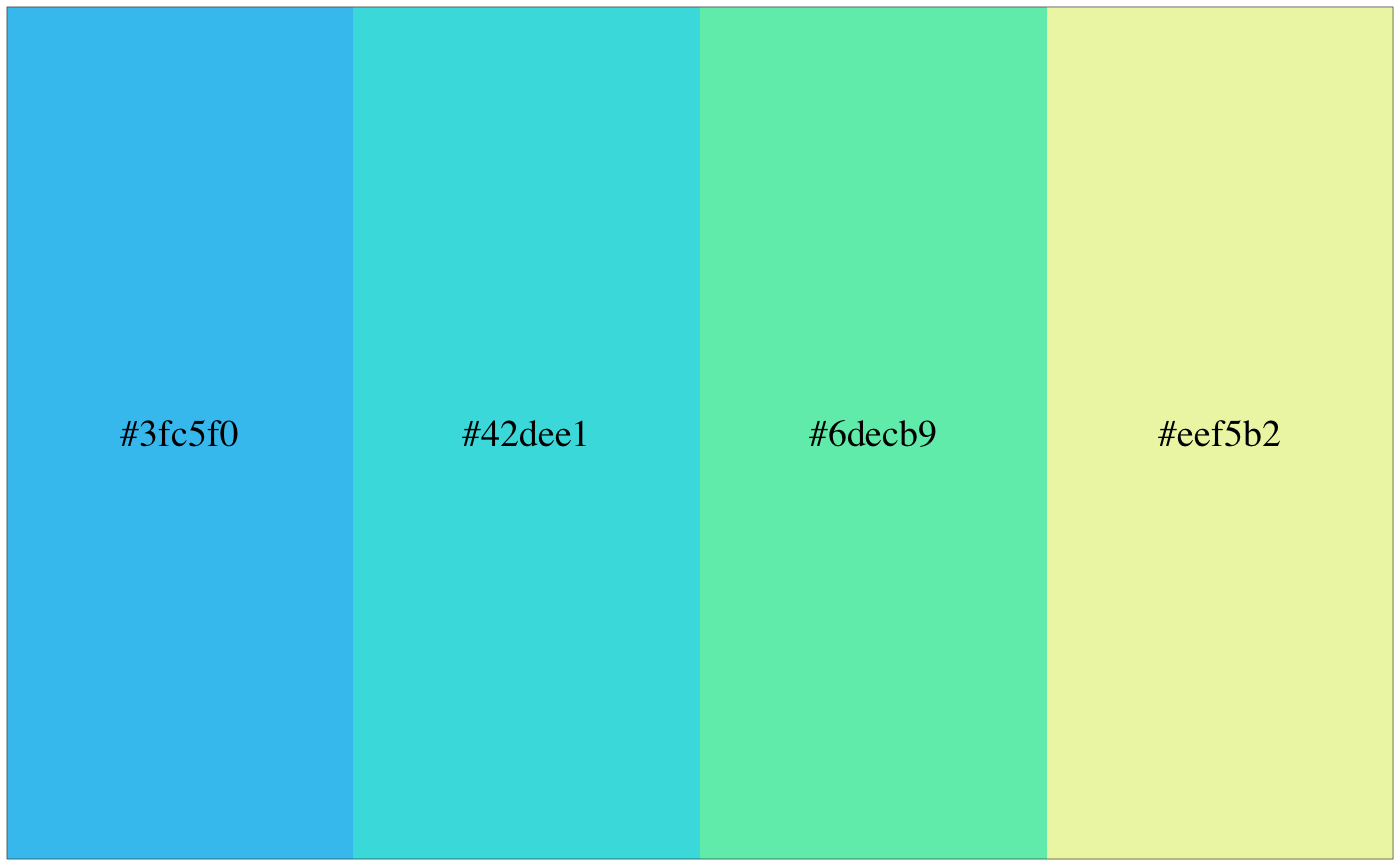
| num_rows | The number of rows to use or if the matrix should be as square as possible. |
| label_size | The size passed to |
| font_family | The font to use for thee plot. Default is "Times". |
| base_size | The base font size passed to |
| ... | Any other information to pass to |
Value
A ggplot2 object.
Examples
show_palette(pal, num_rows = 1)